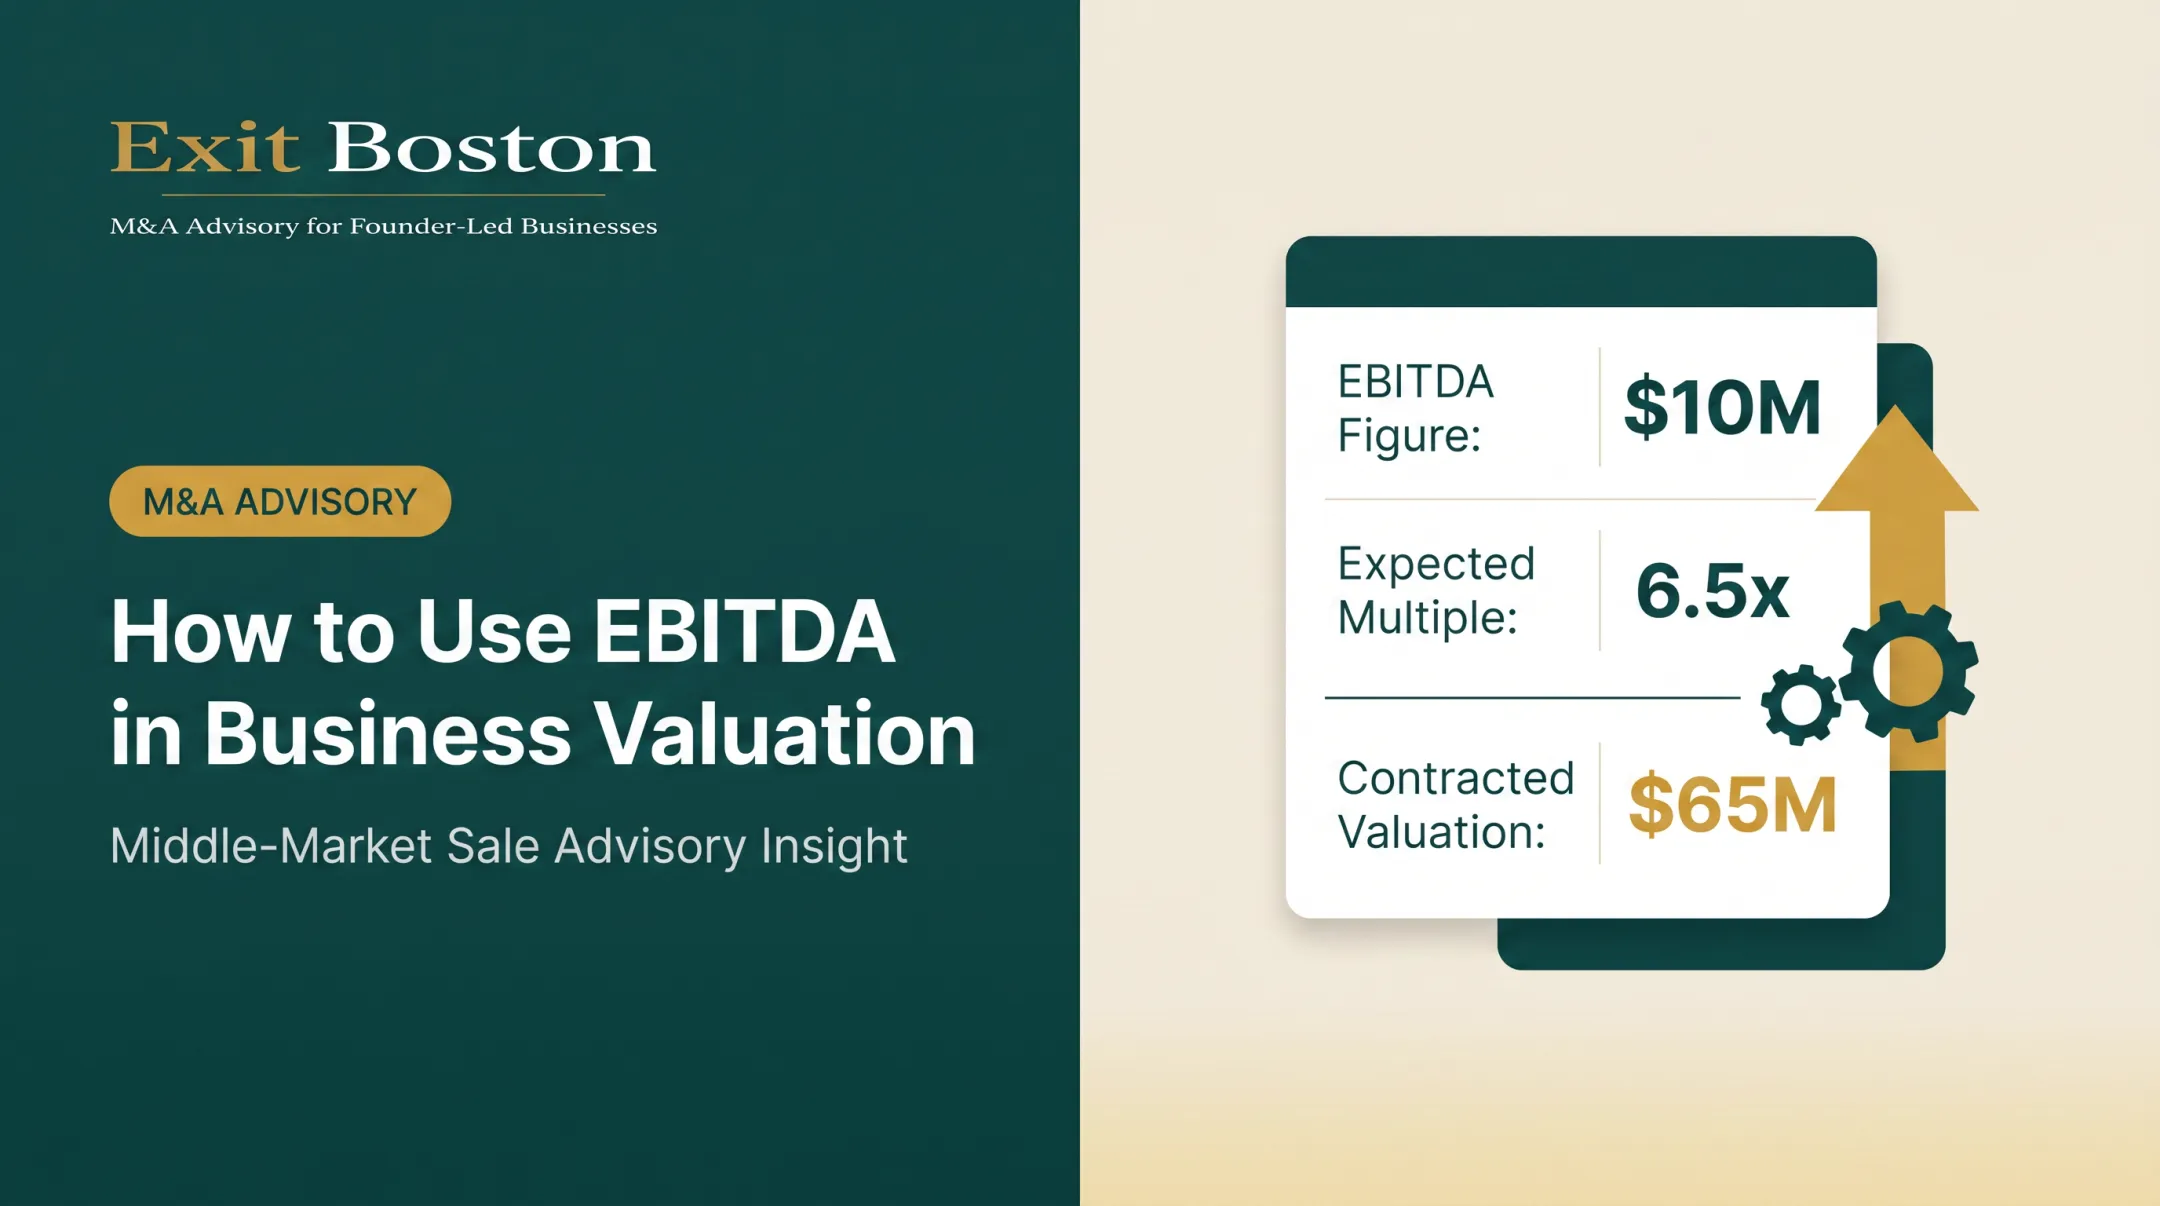

That gap matters. A middle-market company generating $10 million to $100 million in revenue gets valued differently than a Main Street business, and multiples swing widely by sector. GF Data reports a 7.2x average TEV/EBITDA multiple for 2024 and 7.5x for Q3 2025 sponsored transactions, but that's a market anchor, not a sector answer.
There is a bigger point buried in the sector data. The Real Exit is direct about it: one company sells for five times EBITDA, another for ten, another for twelve or more, and "the difference rarely lies in the income statement alone." The multiple is not a property of your industry. It is largely a property of decisions you control.
This guide breaks down valuation multiples by industry, what drives them up or down, and how founders can position their business for the top of its range.
Key Takeaways
- Multiples convert EBITDA, SDE, or revenue into market value; metric choice hinges on company size and profitability
- The spread is owner-controllable: $5 million of EBITDA is worth $25 million at 5x and $50 million at 10x
- Middle-market EBITDA multiples often run roughly 6x–10x; specialty chemicals trade well above that band
- Recurring revenue, management depth, and customer diversification can shift a multiple by a full turn or more
- An experienced M&A advisor benchmarks real transaction comps so you can push toward the top of your industry range
What Are Business Valuation Multiples?
A valuation multiple is a ratio comparing a business's value to a financial metric, typically EBITDA, SDE, or revenue. It's the core tool of the market approach to valuation. You find what similar companies sold for, then apply that ratio to your own numbers.
EBITDA multiples are the standard for profitable, established middle-market companies. EBITDA (earnings before interest, taxes, depreciation, and amortization) normalizes earnings across companies with different capital structures and tax situations, making it the most comparable cash-generation metric.
Revenue multiples step in when EBITDA isn't reliable: pre-profit companies, high-growth businesses reinvesting heavily, or recurring-revenue models where future cash flow is more predictable than current earnings.
SDE (Seller's Discretionary Earnings) adds back one owner's full compensation and benefits, so it fits small, owner-operated businesses. Company-level buyers acquiring institutional-quality assets use EBITDA instead.
Sales Multiple vs. EBITDA Multiple vs. SDE Multiple
| Metric | Best fit | Typical buyer |
|---|---|---|
| SDE | Small, owner-operated businesses under roughly $1M EBITDA | Individual buyers, small strategics |
| EBITDA | Established, profitable companies, generally $2M–$10M+ EBITDA | Private equity, larger strategics, family offices |
| Revenue | Pre-profit, high-growth, or strong recurring-revenue businesses | Growth-focused PE, strategics buying market share |
That split matches Exit Boston's client base: companies generating $2 million to $10 million in EBITDA and $10 million to $100 million in revenue, where EBITDA, not SDE, is the right lens.
Business Valuation Multiples by Industry
Multiples reflect growth prospects, capital intensity, and risk. Across the sectors Exit Boston advises, recent middle-market ranges look like this:
| Industry | EBITDA multiple | Source / period |
|---|---|---|
| Distribution & logistics | 7.4x–7.6x | GF Data, 2025 |
| Building products mfg. & distribution | ~6.9x | Broad manufacturing, 2024 |
| Specialty chemicals & advanced materials | 10.0x avg; 12.3x PE median | Capstone Partners, 2021–YTD 2025 |
| Precision manufacturing, fabrication & EMS | ~6.6x (8x+ top end) | Broad manufacturing, early 2025 |
| Specialty food, beverage & branded CPG | ~7.1x (deal example) | Exit Boston engagement |

Distribution & logistics. GF Data's broad 2025 distribution figure sits around 7.6x EBITDA, with mid-sized deals ($25M–$50M TEV) closer to 7.4x. Route density and contract stickiness (long-standing customer relationships that survive a change in ownership) are what push a distributor toward the higher end. Building products manufacturing & distribution. Broad manufacturing averaged 6.9x in 2024, though this sector runs cyclical. Buyers weigh exposure to housing starts and commercial construction cycles. Channel diversification (multiple distribution paths versus one dominant customer) matters here more than almost anywhere else. Specialty chemicals & advanced materials. This is the standout. Capstone Partners reports a 10.0x middle-market average from 2021 through YTD 2025, with 2025 private-equity deals hitting a 12.3x median. Regulatory barriers and proprietary formulations create real moats: a buyer can't easily replicate a patented formulation or replace an EPA-permitted facility. Precision manufacturing, fabrication & EMS. Broad manufacturing benchmarks (around 6.6x in early 2025) offer the closest proxy available, since no authoritative EMS-only figure exists publicly. What we've seen in practice: long-term supply agreements and a diversified customer base separate the companies achieving 8x-plus from those stuck near the middle. Specialty food, beverage & branded consumer products. Baker Tilly's H2 2024 update notes EV/EBITDA multiples softened somewhat industry-wide while EV/revenue showed signs of rebounding. In one Exit Boston engagement, an independent beer importer with $3.4 million EBITDA had an expected valuation of $18–20 million but closed at $24 million (roughly 7.1x EBITDA) after competitive buyer interest.
What Drives a Higher or Lower Valuation Multiple?
Within any industry range, specific company attributes push a multiple toward the top or bottom. Buyers pay a premium for reduced risk.
The Real Exit sizes the swing with one company. Take $5 million of EBITDA valued at 5x: that is a $25 million enterprise value. After improvements in leadership, revenue quality, operational systems and growth opportunities, the book notes investors may assign 8x or 10x, and at 10x the same $5 million is worth $50 million. Nothing in the income statement changed. The industry table above sets your starting range; what follows decides where in that range, or which range, you end up.
These factors most often decide where a company lands inside its industry range:
- Predictable, non-concentrated recurring or contracted revenue
- An independent management team that reduces owner dependency
- Consistent growth in a defensible niche
- Clean, well-documented recast financials with defensible add-backs
- Larger scale that attracts institutional buyer competition
Customer concentration cuts value fast. Axial's research notes that a target's top 25% of customers typically account for 89% of profits. Concentration like that scares buyers or forces a price discount.
Owner dependency is often the single biggest lever. Exit Boston's label-manufacturing client couldn't clear 4.8x EBITDA while the founder was the business's operational core. After building an independent management structure and shifting the founder into a strategic role, the company closed its initial transaction at 6.4x and eventually reached 8.2x at platform exit.

Buyers pay for the trend line, not last year's numbers alone. Consistent, demonstrable growth in a defensible niche supports a premium.
Questionable add-backs get discounted. When buyers doubt whether adjustments are legitimate, they cut the price. Clean, well-documented recast financials remove that friction.
Scale draws competition. GF Data reported that $10M–$25M TEV deals averaged 6.6x in Q4 2024, below the broader 7.2x average. Bigger, more institutional businesses simply attract more buyer competition.
EBITDA Multiple vs. Revenue Multiple: Which Applies to You?
| Situation | Use this multiple |
|---|---|
| Profitable, established, stable margins | EBITDA multiple |
| Pre-profit or reinvesting heavily for growth | Revenue multiple |
| Strong contracted/recurring revenue base | Revenue multiple (as cross-check) |
| Capital-intensive manufacturer or distributor | EBITDA multiple only |
For growth-stage or SaaS-adjacent businesses, the "Rule of 40" is a useful screen: combined growth rate and profit margin above 40% often supports a stronger revenue multiple. That framework was built for software companies at meaningful scale, generally $50 million-plus in revenue. It does not translate to a distributor, chemical manufacturer, or food company.
Applying the wrong multiple type produces an indefensible number. A 1.0x revenue multiple means something very different for a business with 5% margins than one with 20% margins. Use revenue multiples as a cross-check, not a primary tool, for anything outside pre-profit or highly recurring-revenue models.
How to Increase Your Business's Valuation Multiple Before a Sale
Value creation before a sale process moves a company toward the top of its industry range. The goal is reducing the specific risks buyers price into their offers, not dressing up the numbers.
Positioning a company as an institutional-quality asset (clean financials, a scalable model, minimal key-man risk) attracts competitive interest from private equity, strategic acquirers, and family offices instead of a single lowball bidder.
Steps that have moved the needle for founder-led businesses:
- Build independent leadership so the business can operate without the founder in every decision
- Align management incentives through a formal program tied to enterprise growth
- Convert short-term purchase orders into extended supply agreements to improve revenue visibility
- Commit to a transition period: even two years of founder involvement post-sale reduces buyer risk

The Real Exit's aerospace case runs the full arc. The founder sold at 7.2x on $8.5 million of EBITDA, rolling 20% of proceeds into the new company. Over the private equity hold, EBITDA grew to $19.0 million and the exit multiple expanded to 8.5x, an enterprise value of $161.5 million. His two payments were $48.96 million at the first sale and $47.58 million at the second, a total of roughly $96.5 million. Results like that usually take 12 to 24 months of deliberate preparation before a sale process begins.
An experienced M&A advisor helps here by benchmarking your business against real transaction comparables, then identifying the gaps worth closing before you go to market: customer concentration, management depth, and financial reporting.
Frequently Asked Questions
How do you value a business using multiples?
Start by determining normalized EBITDA or revenue, adjusting for owner compensation and one-time items. Then apply a comparable multiple derived from actual transaction data in your industry and size range.
What multiple should I use for business valuation?
EBITDA multiples suit profitable, established companies. Revenue multiples suit pre-profit or high-growth businesses, particularly those with strong recurring revenue.
What is the typical valuation multiple for a business?
Most middle-market companies trade between 5x and 8x EBITDA, with stronger assets reaching toward 10x depending on industry, size, and financial quality. Specialty chemicals often run higher; distribution and manufacturing usually sit mid-range.
How many times earnings is a business worth?
Most middle-market businesses sell for 5x to 8x EBITDA, with larger, more established companies trading at the higher end. Above-average performers in the $50M-$100M range have averaged close to 8.8x.
What multiple of revenue is a business worth?
Revenue multiples vary widely: often under 1x up through low single digits for distribution and manufacturing, and higher for recurring-revenue models with strong margins. Sector and margin profile drive the range more than any single rule.
What is the rule of 40 revenue multiple?
The rule of 40 says a company's growth rate plus profit margin should equal at least 40%. It's used mainly for growth-oriented and software-adjacent businesses to justify a premium revenue multiple, not for traditional industrial or consumer companies.
Can an owner actually change their own multiple?
Yes, and it is where most of the money is. The Real Exit shows $5 million of EBITDA worth $25 million at 5x and $50 million at 10x, with the gap decided by leadership depth, revenue quality, systems and growth pathways rather than by the industry.