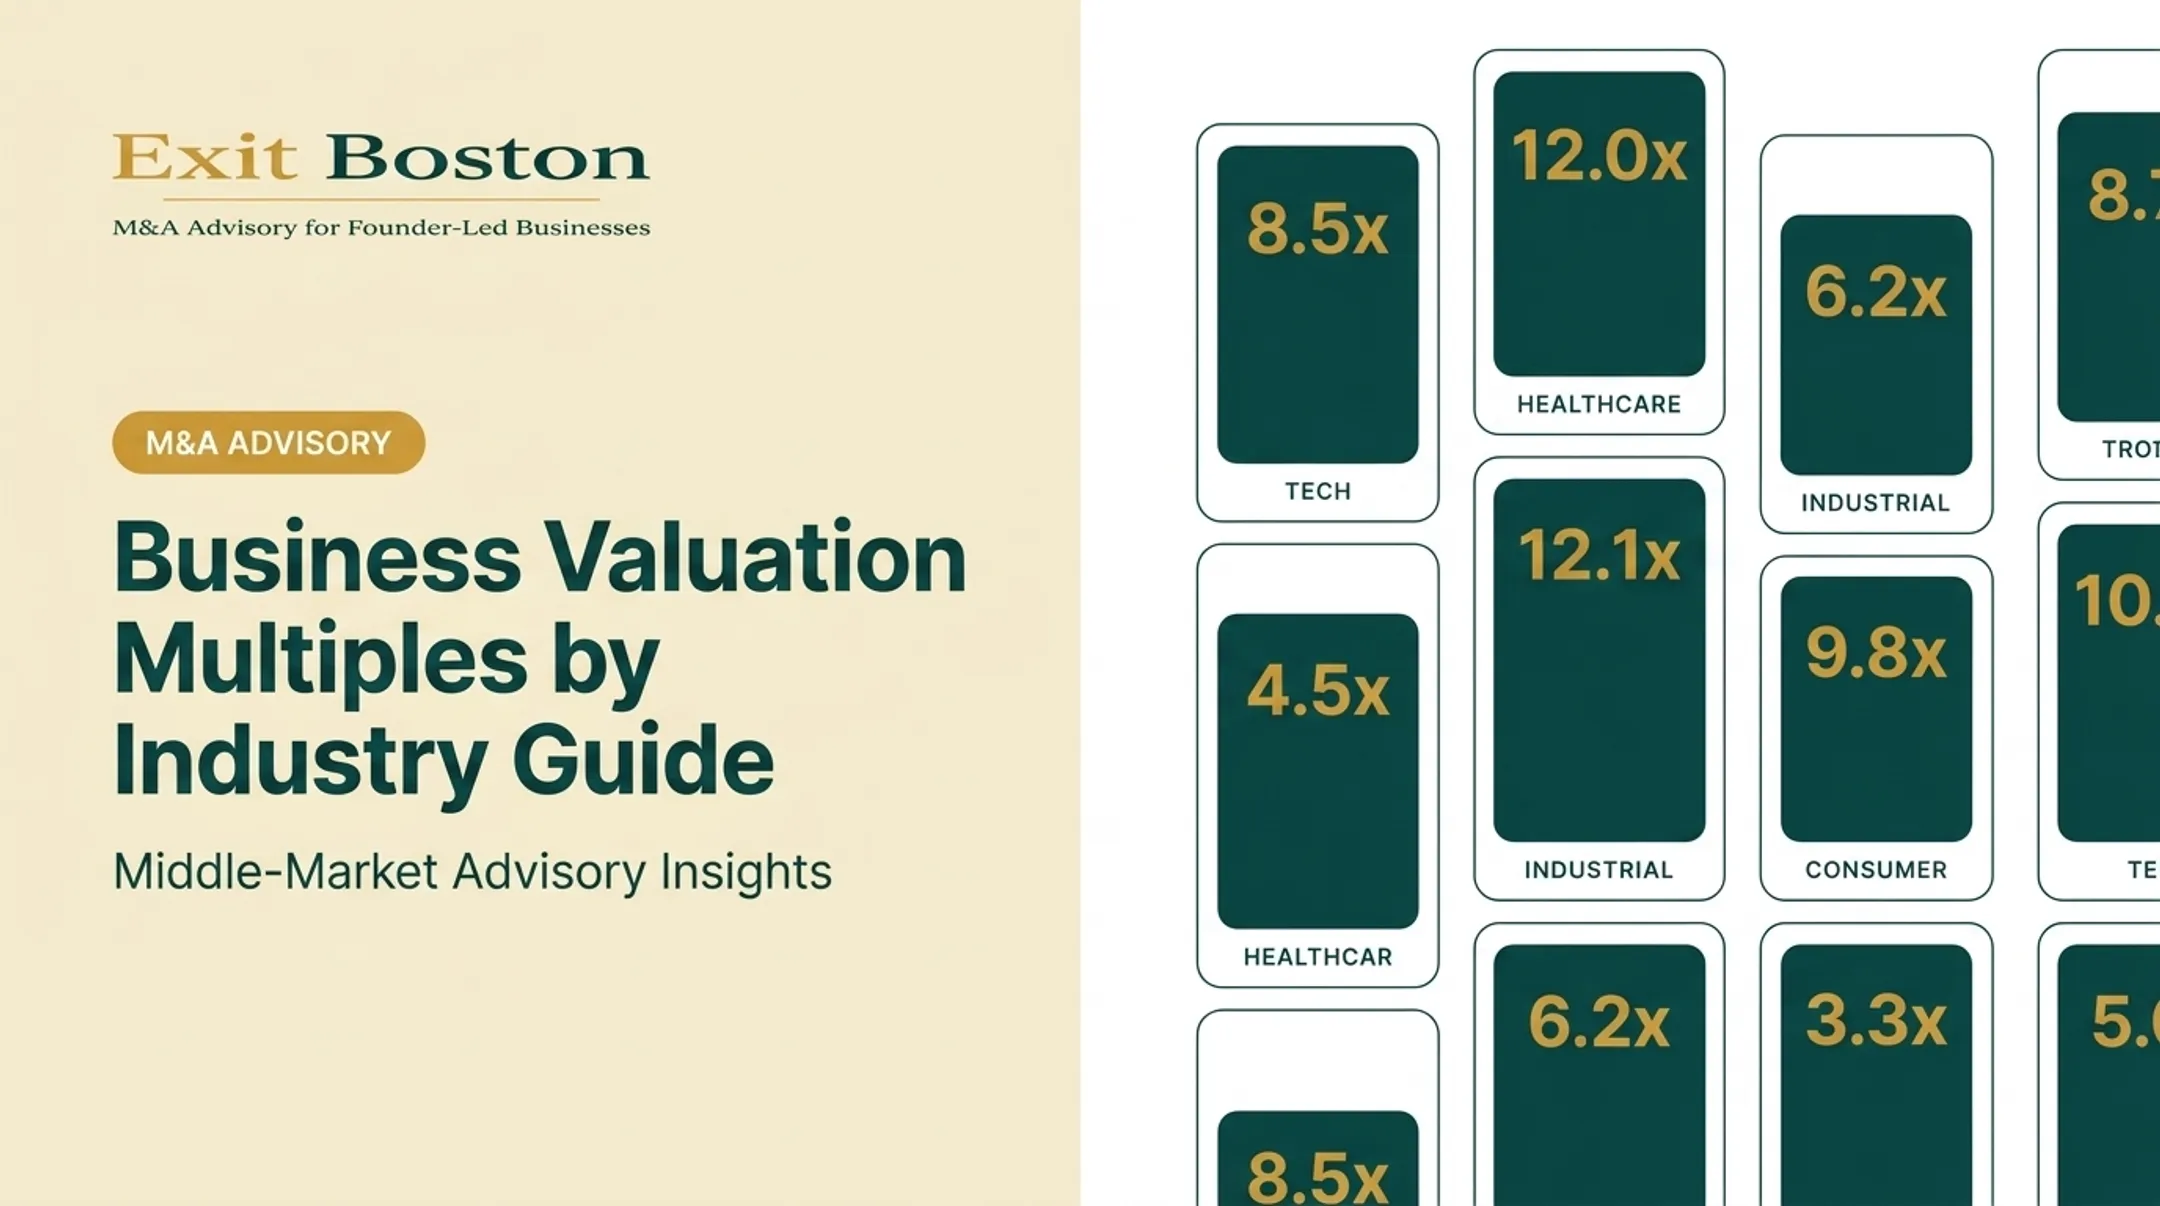

There is a second problem with the industry table, and it costs founders more than the first. The spread inside a single sector is wider than the spread between sectors. Two metal fabrication businesses of similar size in the same state can transact four turns apart. Your industry sets a band. Your tier inside that industry sets your number.
This guide breaks down what EBITDA multiples actually look like across the industries most relevant to founder-led, $10M–$100M revenue companies in 2026, what separates the top tier from the middle, and how to position for a premium outcome. Exit Boston's advisory team, led by Rick McDonald, has been directly involved in 50 to 100 closed middle-market transactions over more than two decades. This piece is grounded in that deal experience, not just public market averages.
Key Takeaways
- Private middle-market multiples in 2026 typically sit mid-single to low-double digits, far below public benchmarks
- GF Data reported a 7.2x average TTM EBITDA multiple across 297 PE-sponsored deals in 2025
- In one New England sector, observed transactions ran 4.0x to 9.0x: the spread inside the industry was wider than the gap between industries
- Reducing founder dependency is the biggest lever owners control to raise their multiple
What Is an EBITDA Multiple and Why It Matters
EBITDA stands for earnings before interest, taxes, depreciation, and amortization. It strips out financing decisions and accounting choices to show a business's core cash-generating power.
The EBITDA multiple formula is straightforward:
Enterprise Value ÷ EBITDA = EBITDA Multiple
Buyers use enterprise value, not equity value, because it lets them compare companies with different debt loads on an apples-to-apples basis. A business carrying $2 million in debt and one with none can still be compared fairly this way.
Public vs. Private Multiples
Here's where founders get tripped up. Public company multiples, like those tracked by NYU Stern, reflect liquid stock, audited financials, and institutional-grade management teams already in place.
Private, founder-led companies carry more risk:
- Thinner management benches
- Less financial transparency
- Lower deal liquidity
Buyers price that risk in.
In practice the multiple is shorthand for how many years of current earnings a buyer will pay for today, adjusted for growth, risk, and how replaceable the founder is.
EBITDA Multiples by Industry in 2026
Here's what the current evidence shows across the sectors most relevant to founders in the manufacturing, distribution, and consumer space.
| Sector | Private Middle-Market Range | Notes |
|---|---|---|
| Distribution/logistics | ~7.4x at $25M–$50M enterprise value | Broader logistics sector data shows figures as high as 12x, but that's not size-specific |
| Manufacturing/fabrication | 5.3x–8.6x depending on deal size | Rises with enterprise value; Westlake reported 7.2x in Q1 2026 |
| Building products | Public comps only, see notes | Public comps run near 11.6x, for contrast only |
| Specialty chemicals | ~12x (North American, not U.S.-only) | Public multiples run notably higher, near 13x–14x |
| Electronic manufacturing services (EMS) | Public comps only, see notes | Public EMS comps (Celestica, Fabrinet) run 29x–38x and don't apply to private deals |
| Specialty plastics | Public comps only, see notes | Recent outlook reports optimism but no exposed multiple |
| Food & beverage | Public comps only, see notes | Public food processing comps sit near 10x |

Three patterns matter most for middle-market founders reading this table.
The ranges are wide, and the width is the story. A manufacturing business at $25M–$50M enterprise value might trade at 5.3x while a similar business at $50M–$100M commands 8.6x. Size, growth, and buyer competition move the number more than industry classification does.
Not every industry uses EBITDA multiples. Banking, brokerage, and other financial intermediaries are valued on assets under management, deposit bases, or regulatory capital ratios. Their earnings structure doesn't map cleanly to enterprise value math.
The Spread Inside One Sector
Exit Boston tracked its own observed and transacted activity in New England metal fabrication and industrial businesses, $10M to $100M of transaction value, from 2024 through mid-2026, on an adjusted EBITDA basis. The observed ranges sorted into three tiers.
| Tier | Observed range | What defines it |
|---|---|---|
| Exceptional | 8.0x to 9.0x | Deep qualified backlog, genuine recurring or program-of-record revenue, automated production with documented throughput, margins meaningfully above sector norms. Rare, and multiple buyers compete. |
| Solid mid-market | 4.5x to 6.0x | Well run and profitable, good customers and reputation. Production manual or semi-automated. Margins at or near sector norms. One or two credible buyers, and the structure carries earnout risk. |
| Behind the curve | 4.0x to 4.5x, or unplaceable | Operating below capacity on aging equipment. Margins compressed. Quality managed by inspection rather than prevention. Institutional buyers pass. |
These are observed transactions in one sector, not a valuation or a national benchmark.
The width is the whole point. On a business generating $3 million of adjusted EBITDA, the gap between five and a half turns and eight and a half turns is roughly $9 million of enterprise value. That is a larger swing than moving your business into a different industry.
Four characteristics separate the top tier, and all four have to be present: a documented backlog of booked work rather than a pipeline of quotes; genuine recurring or program-of-record revenue; automated production with tracked throughput, labor hours per unit, scrap and first-pass yield; and margins above sector norms, which are the visible output of the first three. When all four hold, the business stops being priced as a fabrication shop.
Key Factors That Move Your Multiple Up or Down
Industry sets the range. These factors decide where you land within it.
- Founder/key-man dependency: the most damaging factor in our deal experience. One label manufacturer we advised couldn't clear 4.8x EBITDA, because buyers saw total founder dependence and no management incentives.
- Recurring revenue and contracts: predictable, visible revenue reduces buyer risk and directly supports a higher multiple. Long-term supply agreements matter more than purchase orders.
- Customer concentration: a business with one customer representing 40% of revenue carries obvious risk. Buyers price that concentration into a lower multiple.
- Net working capital: predictable, well-managed working capital signals operational discipline and cash flow reliability.
- Capital expenditure requirements: heavy ongoing capex needs compress multiples because they eat into free cash flow buyers can actually take home.
- Revenue growth rate: demonstrated momentum, not projected growth, is one of the biggest multiple drivers buyers respond to.
- Buyer type: a strategic acquirer chasing synergies may pay more than a financial buyer pricing pure cash flow. Family offices often take a longer view than traditional private equity.

How to Increase Your EBITDA Multiple Before a Sale
Higher multiples come from reducing the risk a buyer sees, not from cosmetic accounting adjustments.
- Build out management depth. Reducing founder dependency is the largest multiple-expansion driver we've seen. The label manufacturer spent six months standing up independent leadership, funding incentives, and locking in a two-year founder transition.
- Normalize EBITDA accurately. Add-backs and one-time expense adjustments need to hold up under diligence. Overstated normalizations create buyer distrust and stall deals late in the process, when it hurts most.
- Address customer concentration 12-24 months out. Converting short-term purchase orders into extended supply agreements, as the label manufacturer did with its large CPG customers, gives buyers confidence revenue will persist post-close.
- Position as an institutional-quality asset. Clean financials and a credible growth story create competitive tension among buyers instead of a single take-it-or-leave-it offer.
Give it time. Operational changes take roughly four to six quarters to reach the financial statements, and a full preparation programme in the fabrication work above ran 18 to 24 months.
The label manufacturer's transformation shows the payoff. It moved from a sub-4.8x ceiling to a 6.4x closing multiple. EBITDA later grew from $3.4 million to $9.0 million, and the subsequent private equity exit reached 8.2x, a $73.8 million enterprise value and roughly $32.17 million in total value to the founder across both events.

Exit Boston builds a buyer-specific Investment Summary around what a given private equity firm, strategic acquirer, or family office actually wants, backed by precedent-transaction and buyer-universe research.
That positioning has historically helped clients land outcomes 20% or more above initial expectations:
- Commercial label printer: $12.0 million sale vs. an $8.0–$10.0 million expectation
- Independent beer importer: $24.0 million close vs. an $18.0–$20.0 million range
Common Mistakes When Using EBITDA Multiples
Owners often misapply EBITDA multiples in ways that inflate price expectations before diligence begins.
- Relying solely on public-company multiples found online. Public comps reflect liquidity, scale, and governance standards private founder-led businesses don't have. A 13x specialty chemicals figure rarely fits a $6M EBITDA private company.
- Confusing revenue multiples with EBITDA multiples. Early-stage or low-profitability businesses sometimes warrant revenue valuations, but that approach breaks down once buyers price profitability.
- Using a single multiple in isolation. A defensible valuation triangulates a market multiple against discounted cash flow and precedent transactions. One number alone rarely survives buyer diligence.
- Treating the industry average as your number. It is the midpoint of a range you may sit four turns away from. Your tier matters more than your sector.
Frequently Asked Questions
What is a good EBITDA multiple by industry?
It depends on your tier, not just your sector. Many middle-market private companies trade in the 4x–8x range, and in one New England sector Exit Boston observed transactions from 4.0x to 9.0x.
What is an average EBITDA multiple?
Averages depend heavily on whether you're looking at public or private data. GF Data's 2025 middle-market private transaction average was 7.2x, while public benchmarks run much higher across most sectors.
Is 3x EBITDA good?
It sits below the lowest observed tier in our own New England fabrication data, which started at 4.0x. Expect it where capacity is underused, equipment is aging, and margins are compressed.
How do I value a company based on its EBITDA multiple?
Multiply normalized EBITDA by the appropriate industry multiple to get enterprise value. Subtract net debt, then adjust for cash and working capital, to arrive at equity value.
What is the Rule of 40 for EBITDA?
The Rule of 40 is a SaaS and tech benchmark stating that growth rate plus profit margin should reach at least 40%. It doesn't translate to manufacturing, distribution, or food and beverage valuation.
Which industry has the highest EBITDA multiple?
Software and healthcare technology usually top the list, often exceeding 20x. Recurring revenue and asset-light models lower buyer risk versus cyclical, capital-intensive industries.